Explored by:
Aubrey D. Johnson
We are now going to investigate the effects of the variables: a, b, c, and k in the ![]() equation and in the
equation and in the ![]() . For our purposes we will use 2a so that the graphs will be slightly larger and easier to examine. First let us hold the b constant at zero and alter only the a, we will also hold our k constant at k=2. We will start with the sin graph.
. For our purposes we will use 2a so that the graphs will be slightly larger and easier to examine. First let us hold the b constant at zero and alter only the a, we will also hold our k constant at k=2. We will start with the sin graph.
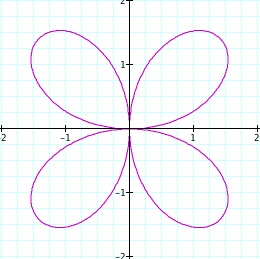
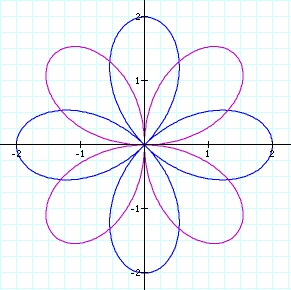
![]()
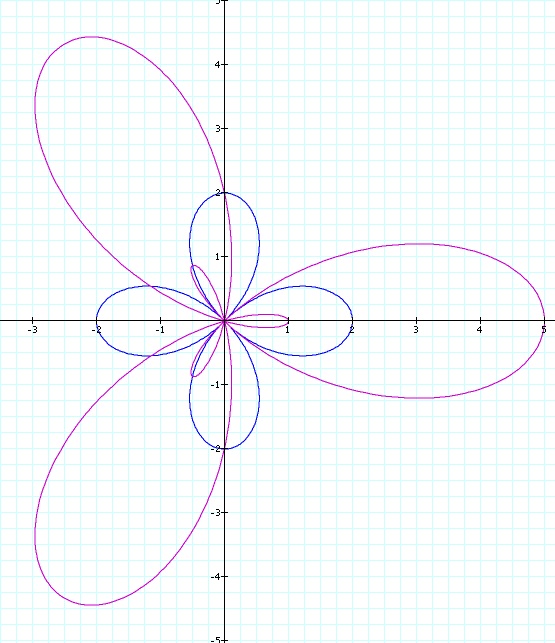
We see that this graph makes a clover shape. Let us see how altering a, from a = 1 to a =2 alters the shape/size of the graph.
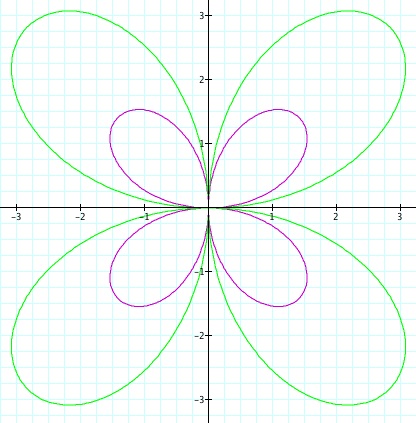
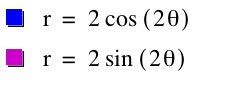
As you can see, changing a=1 to a=2, doubled the overall size of the graph. Before we can assume that a controls the size of the graph, let us see what happens when a = (1/2).
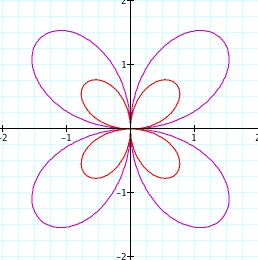
Notice now that the red graph is 1/2 the size of the pink graph. I think that is safe to now assume a controls the size of the graph. We will now use the original sine graph (pink) and alter the b value to see what effects b has on the graph. let us start with b = 1. (We will not alter a, as of now, a=1)
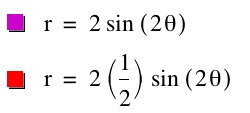
I would have thought that b controlled the placement of the graph, moving the graph to the left and right on the x-axis. Instead b seems to have altered the shape of the graph. Let us see what happens when b=1 is changed to b=2.
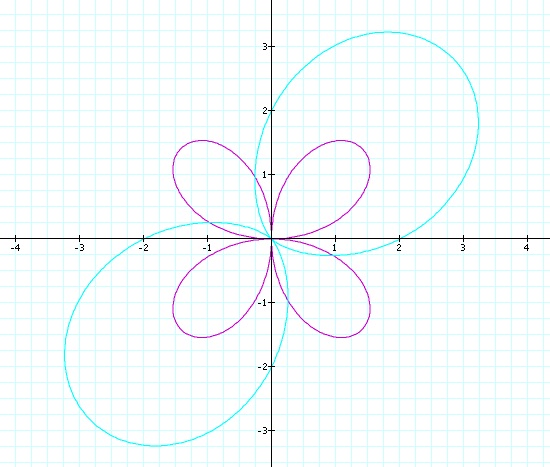
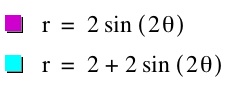
Now the new shape seems to make a complete "figure 8" when b=2. This graph is also larger than the blue graph. The blue graph does not go beyond -3<x<3 or -3<y<3, while the light blue graph extends past three on both the y-axis and the x-axis. Now let us see what the effects of b has on the new graph when we change the b=2 to b= 3.


As is expected the two loops that are in Quadrant I and Quadrant III have gotten larger. These loops are now reaching past -4 and 4 on the y-axis and the x-axis. But there are two new loops. So b does not just control the size of the graph but it also controls the loop number? Let us see what happens when b=4.
So we have seen that a controls the size and that b controls the number of loops and the size...? Let us see what k controls. We will change b back to 0, and we will start with k=1.


Well, this is odd. There is only one loop, that makes a circle. The circle is on the positive side of the graph. Would it flip if I used a -1 for k? Let us try before we move on.

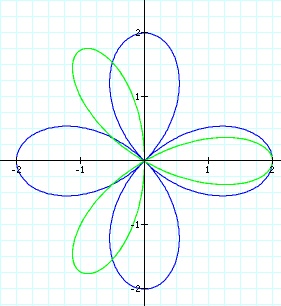
Just as expected, the graph flipped over the x-axis, it is still a circle. Remember the pink graph represent k=2, so let us move on to k=3. So far, we have seen when k=1 there is one loop, when k=2 there are four loops. So, is k=3 going to give us 3 loops, 6 loops or another number? Let us check and see.
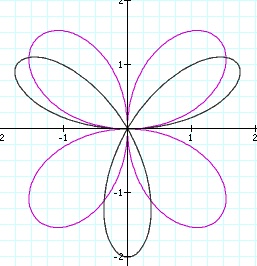
Well this is interesting. Now there are 3 loops, when k=3, so what is the pattern? When k=1 there is one loop. When k=2 there are 4 loops. When k=3 there are 3 loops...Let us see if we can better detect the pattern when k=4. Sometimes the number of loops equals 2 times k, and sometimes the number of loops equals k.

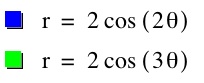
Now there are 8 loops. So maybe the pattern exists when k is an even number larger the number of loops equals 2k, and when k is an odd number the number of loops equals k. Let us see if when k=5, there are 5 loops.

Yes, so now we know that a controls the size of the graph and k controls the number of the loops. But what exactly does b control? From earlier, in the dark blue graph we see that when b=1 the graph becomes a little more simpler. The complexity along with the size of the graph increases as the b value increases. So let us see what b does control. To come up with a hypothesis we will keep a=1 and k=3. let us start with b=1.

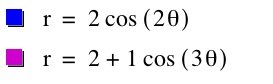
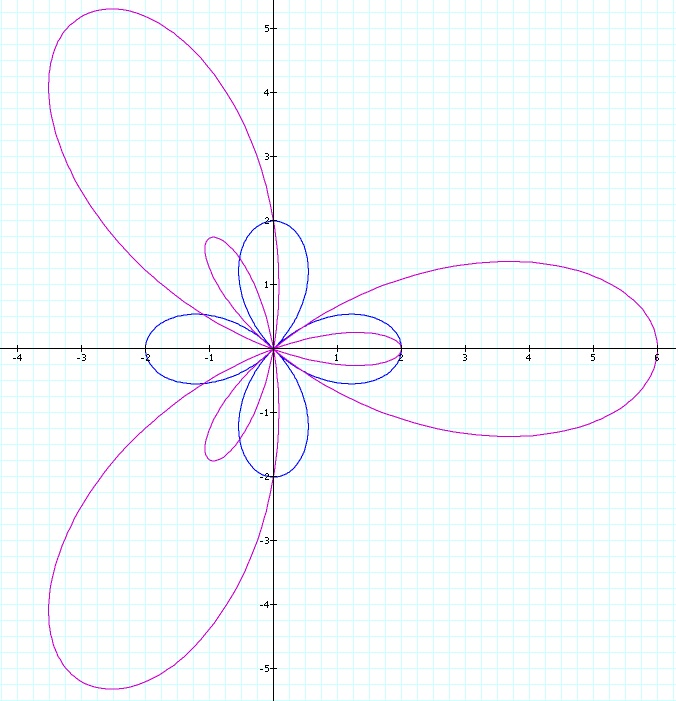
So we see that when b=1 we still have three loops, because k=3. But these loops are not like the loops when b=0 (look above in the black graphs when k=3 we had set b=0). But notice that the graph crosses the y-axis at 1, so does b control where the graph crosses the y-axis. If this is the case then the next graph should have a y-intercept at 2.

Now, the graph is larger. The graph does not have a y-intercept at y=2, but the graph does meet at the origin. So as b approaches k the graph gets larger. When b=0 the graph meets at he origin, it is only when b=1 that the graph does not come to the origin. So what happens when b=k? Let us use b=3 to see.
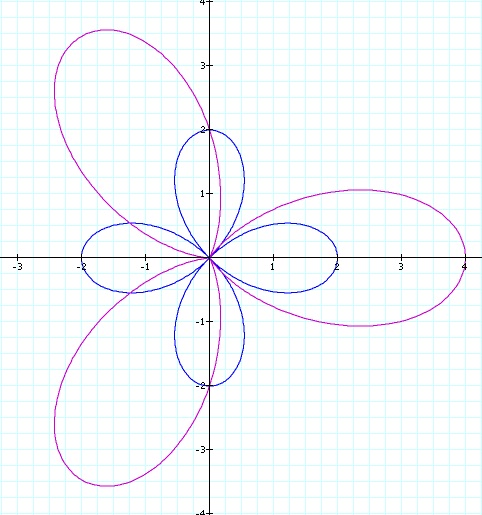
The graph is larger, as to be expected, but now there is a second set of loops. So the number of loops doubles (2k) when b=k. What happens when b>k? Now let b=4 to see.

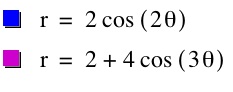
As imagined, the graph continues to grow, both sets of loops are now larger. So when b=3 the number of loops is 2k, with the second set of loops inside the original set. And when b<3 the number of loops equals k. When b=0, the rules we established earlier for k place. Let us make sure by making b=4 and k=4.
OK, so now we see a more complete picture. We see that k controls the number of loops, and when b=3 or when b>3 the number of loops is equal to 2k. When k is odd and there is a b present, the second set of loops are inside the first set. When k is even, the smaller loops are next to the larger ones.
Let us see if our observations hold true for the cosine graph. First let us distinguish the difference between our basic cosine and sine graphs. Then we will investigate, starting with our known theories.
The cosine graph is in blue, notice that it sits on the y-axis and the x-axis. It look very similar to the sine graph. Our reference cosine graph will be dark blue. Let us see if a still controls the size of the graph. let a =3 and then a= (1/2).

So a still controls the size. Let us keep a=1, and alter k. We think that when k is even, the number of loops equals 2k, and when k is odd, the number of loops equals k. So let us try k=3 and k=4.
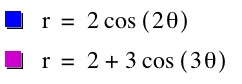
So our theory has held up thus far, k controls the number of loops. So does b still determine the size and complexity of the graph? let us make k=3, and alter b. We will start with b=1, b=2, b=3, b=4.

Notice, that on the sine graph the graph crossed the y-axis at y=1. This graph has an x-intercept at x=1. So while the sine graph was more centered around the y-axis, the cosine graph is centered around the x-axis. We will now continue with the exploration of the effects of b on the graph.

So the rules that we established in our investigation of sine for b appear to hold for cosine as well. Let us make sure, before we make a conclusion, by using b=4 and k=4. If our previous hypothesis is correct then there should be 8 loops total, and they should be next to each other, instead of the second set being inside the first set like when b=3 and k=3.
Yes. All rules from sine also apply tot he cosine graph.
We have seen through our investigation that a controls the size of the graph. The k variable controls the number of loops: when there is a b present the number of loops equals k when k is odd, and the number of loops equals 2k when k is even. Finally the b variable controls the size of the graph as well as the loops of the graph. Variables k and b have a special relationship. When b=3 or when b>3 the number of loops is 2k. The second set of loops is smaller and when k is even the second set is beside the larger set, but when k is odd the second (smaller) set sits inside the larger first set. **All rules apply when a=2, or in our case a=1, because there was always the constant 2 present.**
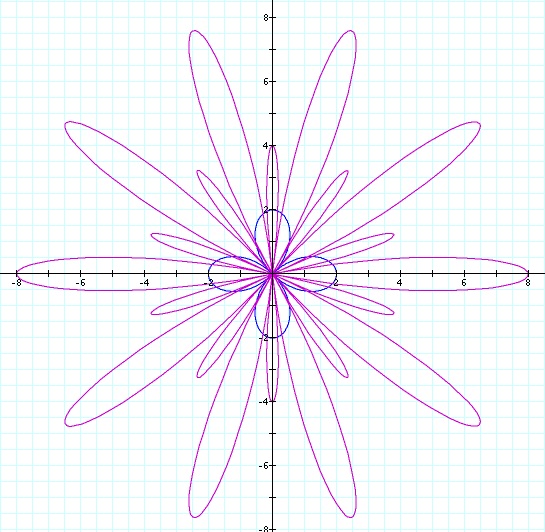
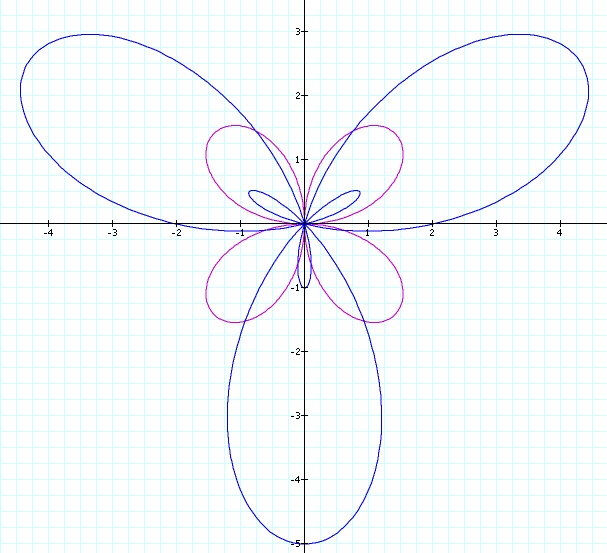
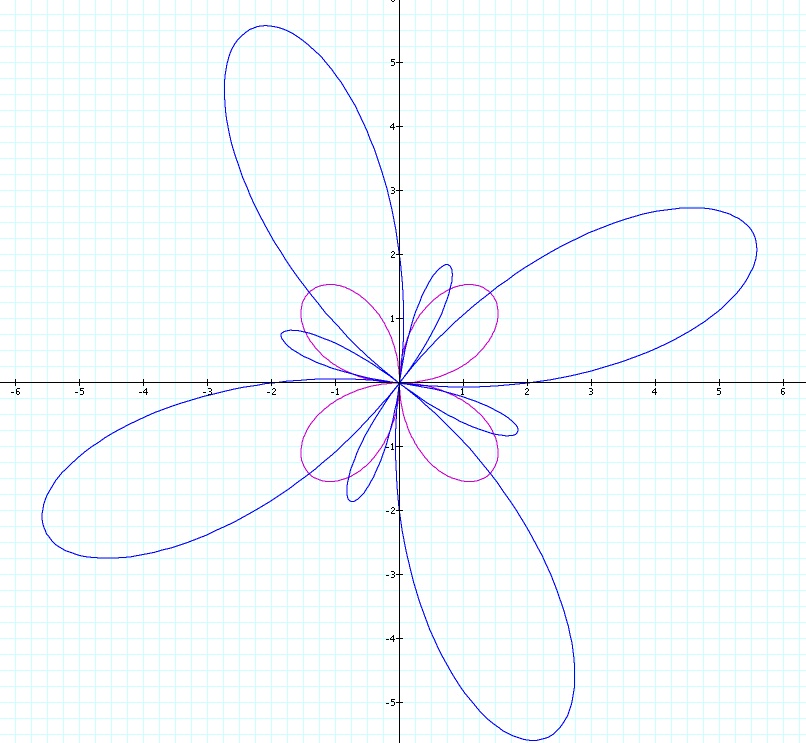
Below are some fun sine and cosine graphs that just further demonstrate the rules we have discovered. See if you can guess their equations.